Key Points
- The majority of Australians voted against the Indigenous Voice, with the No vote recording 60 per cent nationwide.
- Analysis of voting data showed support for Yes in metropolitan areas while No was prevalent in rural seats.
- Polling teams that visited remote Indigenous communities recorded a majority Yes vote.
Australians comprehensively rejected the Indigenous Voice to Parliament over the weekend, with both a majority of voters and every state deciding against the proposal.
, 60 per cent of enrolled voters, with only the ACT delivering a Yes vote.
Find out how rural and metro seats voted in our interactive graphic below.
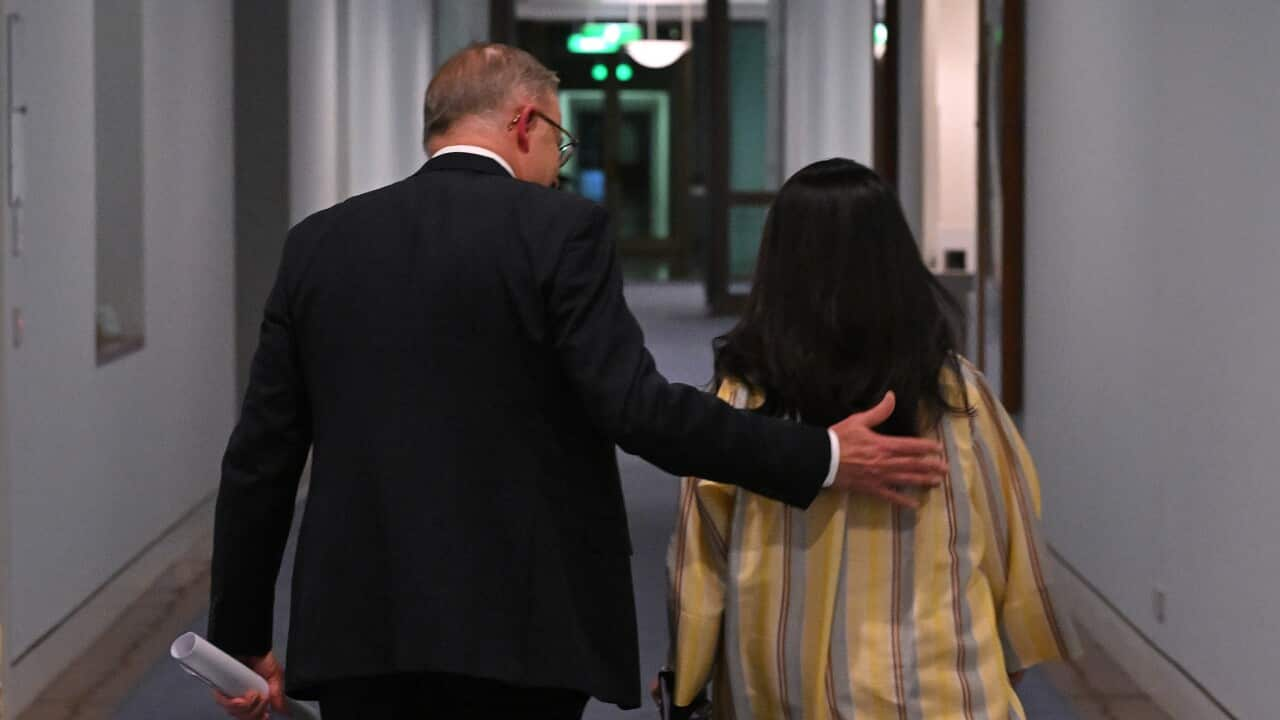
Prime Minister Anthony Albanese said on Monday in Question Time that while the result was not what he "hoped for", it was not a mandate to continue with the "status quo".
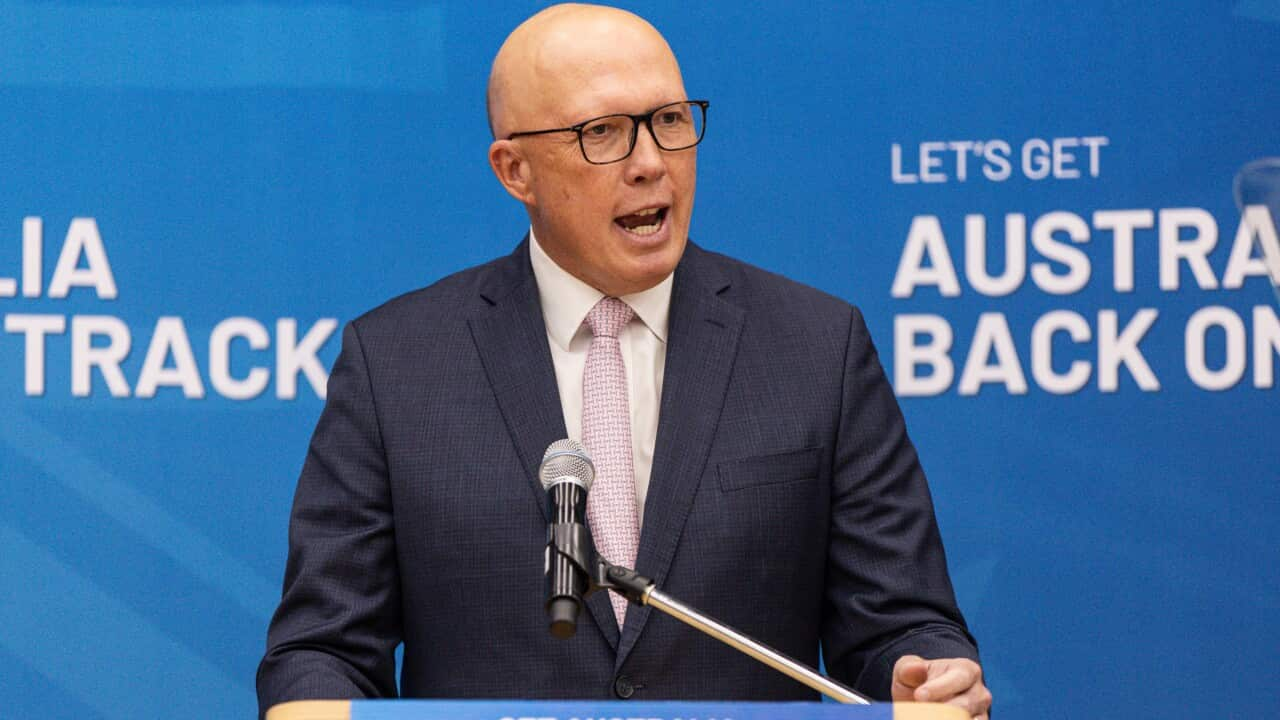
Meanwhile, has demanded the prime minister apologise for going ahead with the referendum without bipartisan support and "dividing" the country.
A breakdown of the referendum votes reveals trends across different states and a divide on the issue between metropolitan and rural voters.
Inner-metropolitan areas had the highest support for the Voice, with 25 electorates voting Yes.

Prime Minister Anthony Albanese's seat of Grayndler had one of the highest Yes votes in the country. Source: AAP / Ethan James
However, dived in outer metropolitan areas, with just five of 43 seats voting Yes.
The No vote was popular in provincial and rural electorates, with 61 of 63 deciding against the Voice. The two provincial seats to vote Yes were Newcastle and Cunningham, both in NSW.
Queensland delivered a No vote of around 69 per cent, with the top six seats to vote No nationwide falling within the state.
These electorates were: Maranoa (85.06 per cent), Flynn (83.88 per cent), Capricornia (81.01 per cent), Hinkler (80.8 per cent), Dawson (80.69), Kennedy (80.55).
All 10 electorates in South Australia delivered a No vote.
How many Indigenous Australians voted Yes in the Voice referendum?
In the Northern Territory, both seats - Solomon (which covers Darwin and surrounding areas) and Lingiari (which covers the rest of the territory) have high Indigenous voting enrolment.
According to data from the Australian Electoral Commission, the No vote in Solomon was 64.8 per cent, and the Yes vote 35.2 per cent.
In Lingiari, the Yes vote was 44.3 per cent and the No vote 55.7 per cent. But just one of the 22 Remote Mobile Teams returned a majority in favour of No.

Perth residents voted No, but a look at the remainder of the electorate revealed a high Indigenous vote. Source: AAP / Richard Wainwright
In Queensland, the referendum was voted down in the seat of Leichhardt by residents in Cairns and surrounds, with 65.3 per cent voting No and 34.7 per cent voting Yes.
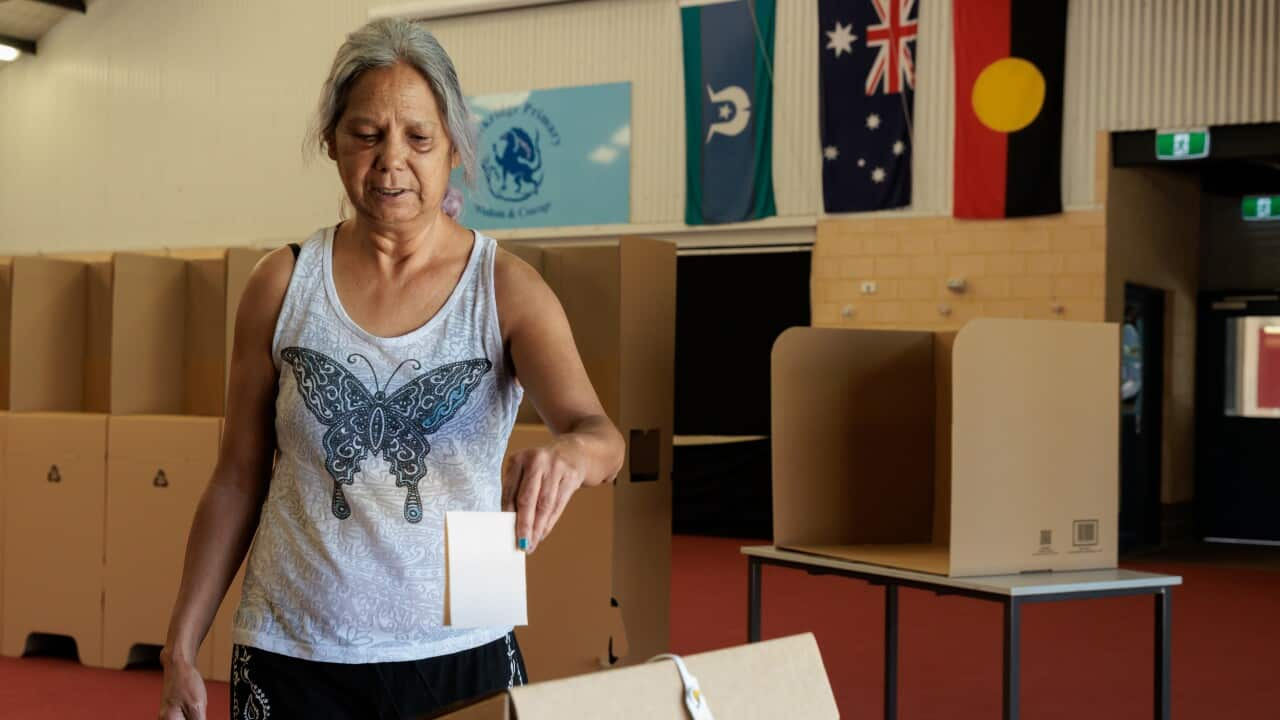
However, the five Remote Mobile Teams recorded majority Yes votes in Indigenous communities.
Remote in the tropical northern tip of Queensland included Hope Vale (75.4 per cent), Thursday Island (72.38 per cent) and Lockhart River (66.1 per cent).
This trend was also evident in Western Australia's seat of Durack, which stretches from Perth to the Northern Territory border.
While 72 per cent of Durack residents voted No, 10 remote voting teams recorded majority Indigenous Yes votes with one community showing 89.19 per cent support.
