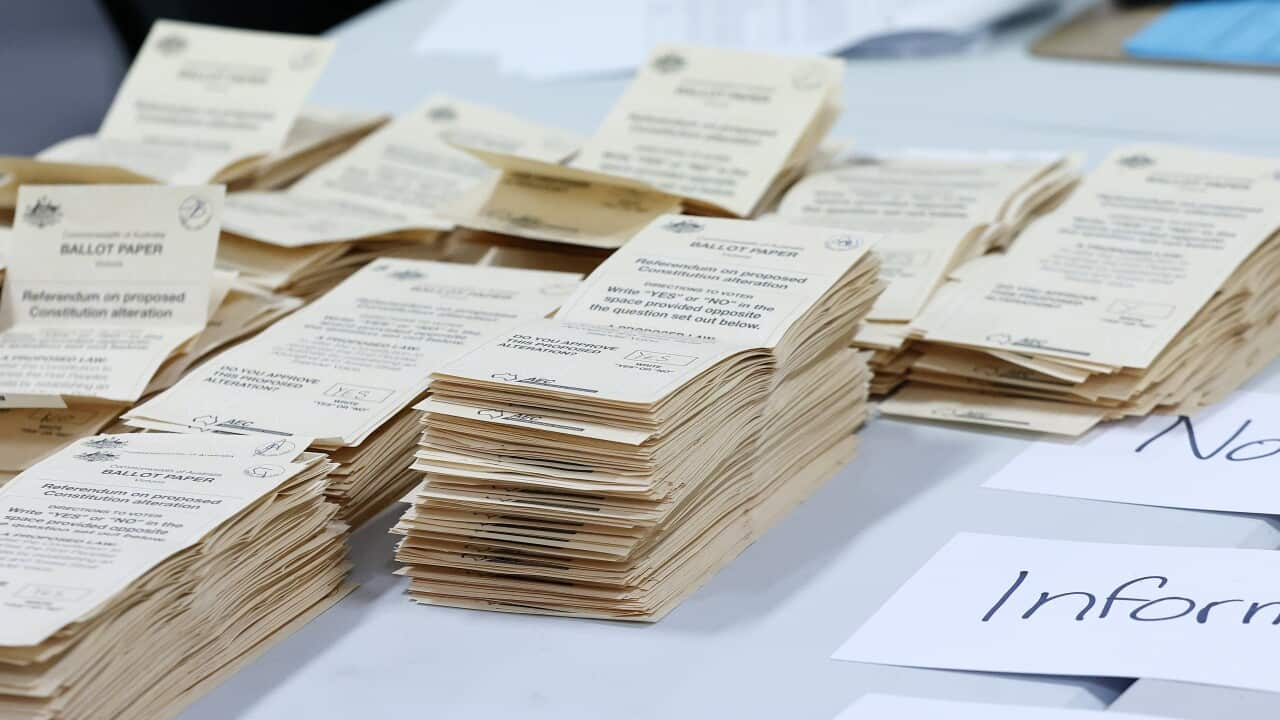
The referendum to enshrine an Aboriginal and Torres Strait Islander Voice to Parliament was defeated on Saturday night.
All states and territories, with the exception of the ACT, voted against the proposal.
Despite the outcome, voting data reveals that the majority of Indigenous communities backed the yes campaign - seeking the installation of a Voice.
Here's the rundown of how Indigenous communities across the country voted.
Queensland
The Division of Kennedy in Queensland has an Indigenous population of 16 per cent. Only 19 per cent of the electorate voted yes.
However, the suburbs within Kennedy that have a high Indigenous population, reported majority yes votes.
Mornington Island, where the population of Aboriginal and Torres Strait Islander peoples is 80 per cent had one of the highest yes votes in Queensland, with 78 per cent voting yes.
Yarrabah, with an Indigenous population of 96 per cent, had 76 per cent of people vote yes.
In the remote town of Domadgee, which is a largely Indigenous community, 66.09 per cent of people voted yes.
Similarly, in the Division of Leichardt, 65.3 per cent of residents in the electorate voted no, but communities with high Indigenous populations swung to yes.
Hope Vale had a resounding support for the Voice, with 75.40 per cent voting yes.
Wujal Wujal had 66.19 per cent of residents support a yes, Lockhart River had 65.38 per cent, Bamaga 59.64 per cent and Pormpuraaw slightly lower with 55.23 per cent.
Coen, which reported 47.83 per cent of yes votes, and Kowanyama , with 50.75 per cent yes votes were more evenly split between yes and no. However, showed a greater margin of yes votes than that supported in the total yes votes of the electorate.
Western Australia
Western Australia had 63.5 per cent of the state vote no.
Moreover, 72.2 per cent of residents in the Division of Durack voted no.
Towns with a high Indigenous population that fall under Durack had a higher percentage of residents vote yes.
Fitzroy Crossing, which has an Indigenous population of 80 per cent, had 60.1 per cent of residents vote yes.
Halls Creek, where 70 per cent of residents are Indigenous, recorded 52.2 per cent of votes for yes and Wyndham, with an Indigenous population of 60 per cent, had 60 per cent of residents vote yes.

Halls Creek in the Kimberley had strong support for the Voice to Parliament. Source: AAP / Richard Wainwright/AAP Image
Northern Territory
The Northern Territory voted 60.5 per cent in favour of the Voice. A similar ratio to the national percentage.
The seat of Lingiari covers almost all of the territory, excluding Darwin. It’s homed to the largest proportion of Indigenous residents, with 40 per cent of the population being Indigenous.
In Lingiari, 55.7 per cent voted no, and 44.3 per cent yes.
But remote mobile polling booths painted a different picture.
Of the 22 remote mobile teams, all bar one delivered overwhelming yes support. The highest support in the Territory came from Wadeye with 92.1 per cent. Almost 86 per cent of people in Wadeye are Indigenous.

Purple statistics show support for a yes vote in remote polling booths in remote communities in the Northern Territory. Credit: Anthony Green
The lowest yes support recorded by the remote mobile teams sat at 49 per cent.
Of the over 10,000 remote ballots counted, 72 per cent voted to enshrine the Voice to Parliament.
