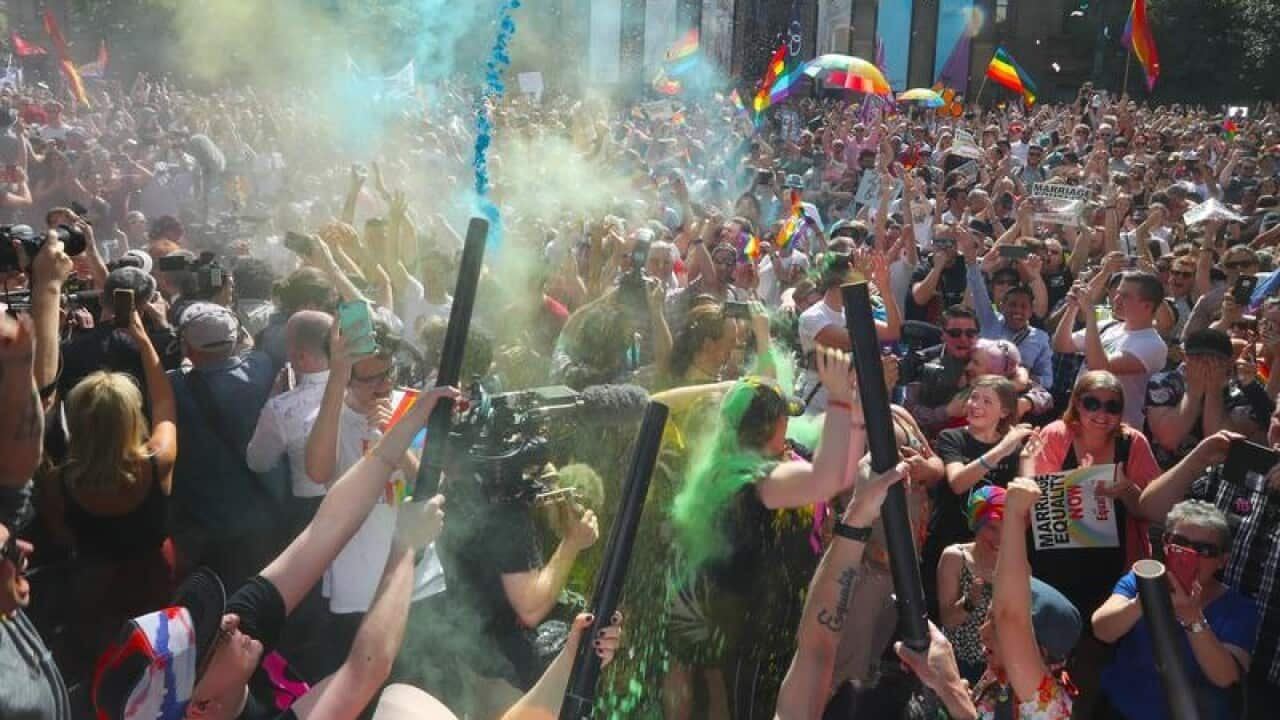
HOW AUSTRALIA VOTED ON SAME-SEX MARRIAGE
Yes: 61.6 per cent (7.8 million)
No: 38.4 per cent (4.9 million)
Proportion of Australians who voted: 79.5 per cent (12.7 million*)
STATE BY STATE
NSW: 57.8 per cent (yes) 42.2 per cent (no)
Victoria: 64.9 per cent (yes) 35.1 per cent (no)
Queensland: 60.7 per cent (yes) 39.3 per cent (no)
SA: 62.5 per cent (yes) 37.5 per cent (no)
WA: 63.7 per cent (yes) 36.3 per cent (no)
Tasmania: 63.6 per cent (yes) 36.4 per cent (no)
NTL 60.6 per cent (yes) 39.4 per cent (no)
ACT: 74 per cent (yes) 26 per cent (no)
(*includes non-clear responses)
