House price inflation is back in double figures.
A 1.6 per cent rise in capital city prices in May boosted the annual growth rate from 7.3 per cent to 10 per cent, the fastest annual pace since October, according to CoreLogic RP Data.
The biggest gains in May came in Sydney, where prices rocketed by 3.1 per cent, though Melbourne's annual growth rate is still the fastest at 13.9 per cent, compared with Sydney's 13.1 per cent.
At the other end of the scale, the mining boom's end continued to weigh on Darwin and Perth, where prices in May were lower than a year earlier.
Median dwelling prices in Sydney are now at $782,000, with Melbourne a distant second at $590,000.
CoreLogic head of research Tim Lawless said it was hard to establish the extent of investor involvement in the latest market surge, although figures from the Australian Bureau of Statistics up to March suggest a great proportion of loans were being taken up by investors.
"Anecdotal evidence suggests investor numbers may have increased further from this time," he said.
Some lenders have been loosening credit requirements after lending to investors began tracking well below the "speed limit" of 10 per cent per annum, championed by the Australian Prudential Regulation Authority since December 2014.
Figures from the Reserve Bank on Tuesday showed investor housing credit growth at just 6.5 per cent.
"Based on this, lenders now have scope to increase lending to investors," Mr Lawless said.
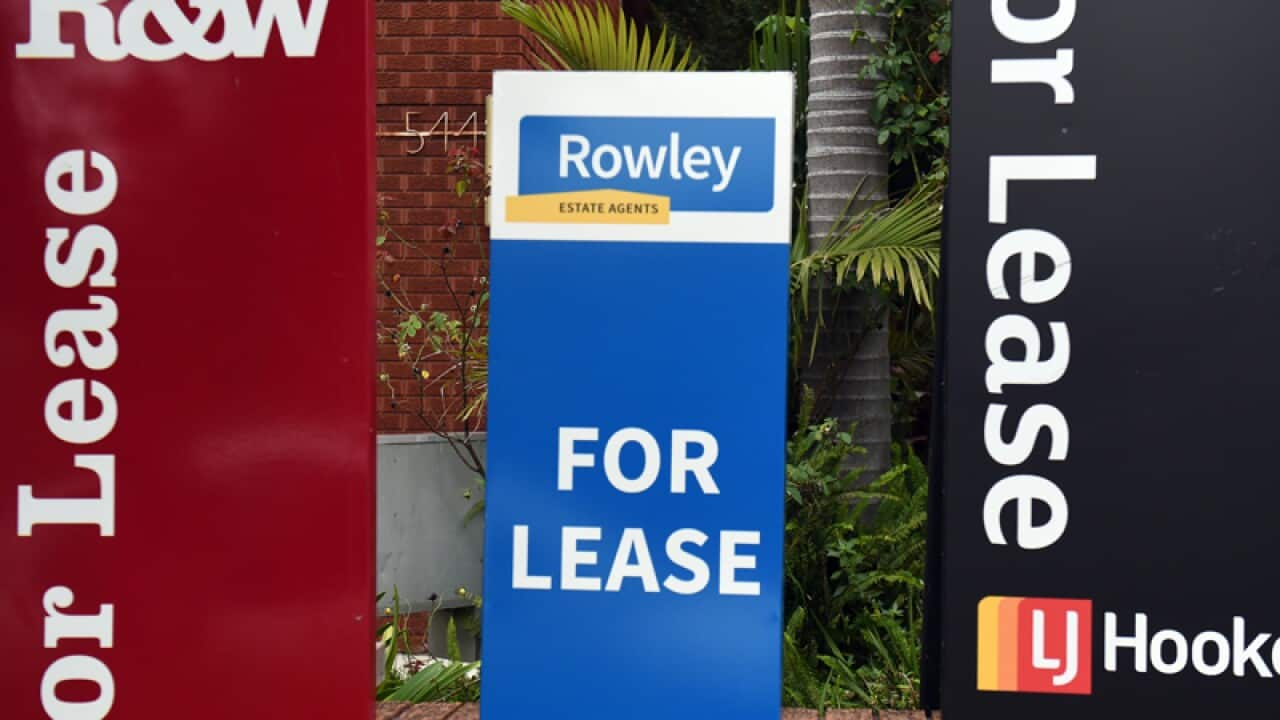
The ongoing rise in prices has not been matched with by rents, leading to a further compression of rental yields - rental income as a proportion of the property value.
MEDIAN HOME PRICES AND ANNUAL RISES
Sydney: $782,000, +13.1pct
Melbourne: $590,000, +13.9pct
Canberra: $550,000, +5.7pct
Darwin: $519,000, -3.5pct
Perth: $506,000, -4.2pct
Brisbane: $475,000, +7.1pct
Adelaide: $415,000, +3.9pct
Hobart: $335,000, +6.1pct
Combined capitals: $580,000, +10.0pct
Source: CoreLogic RP Data


